

A reader asked if 'rank is unstable' was measured or folklore. So we measured it.
Key findings
- What varies between runs is who makes the list, not how the list is ordered. Between runs of the same prompt, roughly a quarter of the recommended-brand set turns over (set overlap 0.74, from the parent study) — but among the brands that appear in both answers, relative order holds at a mean Kendall’s tau of +0.64 [+0.62, +0.67]. In 46% of pairs the shared brands come back in exactly the same order; full reversals occur in under 1%.
- Even across differently-worded prompts, order agreement stays well above zero: mean tau +0.36 [+0.31, +0.41], with 31% of pairs in perfect agreement.
- The top slot is the exception — rewording resets it to a coin flip. Two runs of the same prompt open with the same brand 68% of the time; two differently-worded prompts agree only 40% of the time, which is exactly the chance rate implied by the market’s first-mention mix (39.9%, driven by one brand opening 60% of answers).
- This is, to our knowledge, the first public coefficient on AI recommendation rank stability. Prior evidence — including the SparkToro study ours extends — mixed platforms and single runs, where set churn and platform differences dominate whatever rank is doing.
Why we measured this
After we published our prompt-phrasing study, a reader asked a question we couldn’t answer with a number: when we said brand rank in AI answers isn’t stable, was that a computed statistic or an eyeball read?
It was an eyeball read, inherited from the January 2026 SparkToro study our experiment replicated and extended. Their data showed ordering bouncing around freely. But their design ran each prompt once across seven different platforms, which means observed rank variation bundled together three things: genuine rank instability, brands entering and leaving the answer entirely (set churn), and platform-to-platform differences. Our replication data — one platform, 143 phrasings, each run daily for a week — can separate them. The reader was right that nobody had published the number, and right that this dataset could produce it. Everything below is a post-hoc analysis of the frozen experiment 002 data, labeled exploratory throughout.
Methods in brief
“Rank” here means the order in which brands are first mentioned in the answer text — a proxy, since ChatGPT’s answers are prose and only sometimes explicit rankings. For every pair of runs (1,001 headphone runs evaluated in this study), we computed Kendall’s tau over the brands both answers contain, requiring at least three shared brands. That makes the statistic order-only and conditional on membership: the churn of brands in and out of answers — which our main study already quantified with set overlap — is deliberately excluded, so tau answers the reader’s actual question. Pairs are compared within-prompt (same prompt, different days; 82% have 3+ shared brands) and between-prompt (different phrasings, same day; 70% qualify). Confidence intervals come from the same prompt-level cluster bootstrap as the main study.
Kendall’s tau runs from +1 (identical order) through 0 (no association) to −1 (exactly reversed). For context, tau on three shared items can only take four values, so the averages below are coarse-grained per pair and stable in aggregate.
Result 1: order is sticky — very sticky for the same prompt
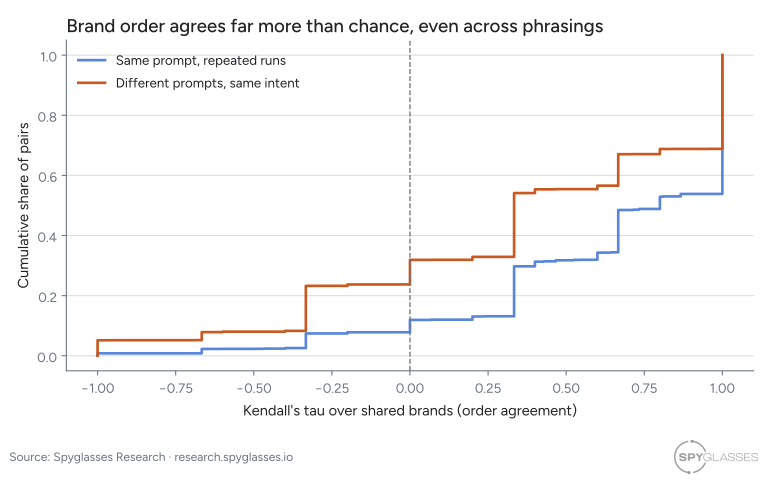
Distribution of pairwise order agreement (Kendall’s tau over shared brands, 3+ required). A large mass sits at tau = 1 — identical ordering — in both conditions. Exploratory.
Re-run the same prompt on different days and the shared brands come back in the same relative order far more often than not: mean tau +0.644 [+0.615, +0.673], perfect agreement in 46.2% of pairs, order-reversals in 0.9%. Only 12% of pairs show zero or negative association. For a statistic the folklore says is noise, that is a lot of signal.
Across differently-worded prompts the agreement drops but doesn’t collapse: mean tau +0.358 [+0.311, +0.410], with 31.2% of pairs still in perfect agreement. Rewording the question costs about as much ordering agreement as it costs set membership — but in neither case does it approach randomness.
The mechanism is no mystery in hindsight: the order of first mention tracks the same popularity gradient that drives membership. Sony doesn’t just appear in 90% of answers; it opens 60% of them. Order inherits stability from the same skewed mention frequencies that make the leaderboard stable.
Result 2: the top slot is the genuinely unstable part
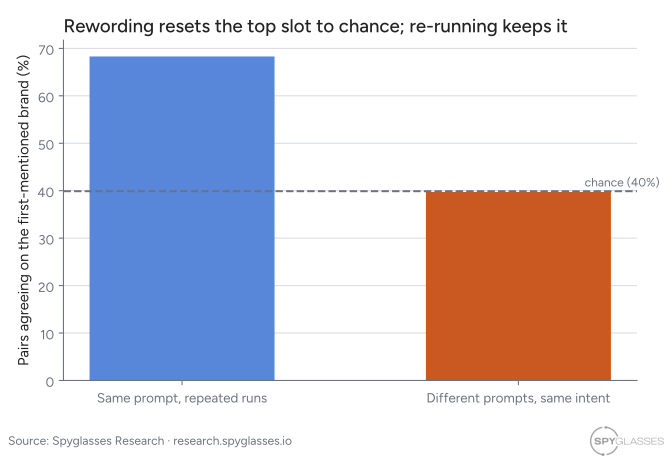
Agreement on which brand is mentioned first. The dashed line is the chance rate implied by the overall first-brand mix. Between-prompt agreement lands exactly on it. Exploratory.
Whether two answers open with the same brand is a different story, and it’s where the instability intuition survives. The same prompt re-run keeps its opener 68.3% of the time [65.4%, 71.1%] — far above chance. But two differently-worded prompts agree on the opener 39.7% of the time [36.0%, 43.7%], and the chance baseline computed from the empirical first-brand mix is 39.9%. The match is almost embarrassing: with respect to the lead position, rewording the prompt is statistically indistinguishable from drawing an opener at random in proportion to how often each brand opens answers overall. (Answer share within this study, to be clear — we measured nothing about real-world market share, however correlated the two may be.)
So if your interest is “who gets mentioned first,” phrasing genuinely scrambles it. If your interest is “does the ordering of the list mean anything,” it does — and it means the same thing across phrasings much more often than chance.
What this refines about the folklore
The two statistics are designed to be complements: the parent study’s set overlap measures whether a brand survives from one answer to the next, and tau measures order among the survivors. Put them together and the combined claim is sharper than either alone: the churn lives in which brands make the answer; the ordering of the brands that stay is largely conserved. Roughly a quarter of the set turns over between same-prompt runs, and the surviving order mostly holds. That’s more precise than a blanket verdict for or against rank as a metric, and we haven’t seen it stated with numbers attached before.
The “AI rank is chaos” impression comes from real observations, but our decomposition suggests it was mostly measuring other things:
- Set churn, not rank churn. Brands entering and leaving the answer (our main study’s headline effect) destroys apparent rankings without any reordering of what remains. Tau conditions that away and finds order beneath the churn.
- Platform mixing. Single runs spread across seven platforms — the original study’s design, appropriate for its question — can’t distinguish rank instability from platforms simply ordering brands differently. On one platform, held constant, order is moderately-to-strongly conserved.
- The top slot really is unstable across phrasings — at exactly chance — and the top slot is what most people look at. The most salient rank position is the least stable one, which is exactly the recipe for a folklore of chaos built on accurate glimpses.
To be clear about the relationship to SparkToro’s work: their conclusion was sound at their design’s scope, and their study is the reason this dataset exists. This result doesn’t overturn it; it decomposes it, on one platform, into a stable component (relative order among shared brands) and an unstable one (lead position across phrasings).
Two ways these numbers could flatter us — checked
The same reader flagged two selection effects that could make tau look better than it is. Both are checkable, so we checked (the numbers are in the analysis output).
Are the excluded pairs the unstable ones? Tau requires 3+ shared brands, which drops 18% of within-prompt pairs — plausibly the least stable, since low overlap and disorder could travel together. The largest excluded group, pairs sharing exactly two brands, permits one order comparison each: within-prompt, those pairs are concordant 76.1% of the time against a 50% coin — equivalent to tau ≈ +0.52. Between-prompt, 59.4% (tau ≈ +0.19). So the direction of the concern is right — the dropped tail is less ordered than the included pairs — but the size is small: the excluded pairs are diluted, not chaotic, and no headline changes if you fold them in. Within included pairs, mean tau is also nearly flat across shared-set sizes (+0.60 at three shared brands, +0.65 at four, +0.70 at five), so there’s no gradient suggesting the tail below the cutoff falls off a cliff.
Does the 12% of disordered pairs mean some prompts are hopeless? Only if that disorder concentrated in particular prompts — and it doesn’t. The 295 zero-or-negative within-prompt pairs are scattered across 63 different prompts; the five worst prompts account for just 54 of them. At the prompt level, exactly 2 of 136 prompts have a mean within-prompt tau at or below zero, and the 10th-percentile prompt still averages +0.22. Ordering stability is heterogeneous — the median prompt averages +0.68 and the bottom decile is mediocre rather than inverted — but essentially no prompt lives in the chaotic regime. A negative-tau pair is an event that happens to a stable prompt occasionally, not a property some prompts have.
What we can and cannot claim
- Everything here is post-hoc and exploratory — computed after publication, in response to a reader question, with no pre-registration and no multiplicity correction. The CIs are honest but the hypothesis was chosen after seeing the main results.
- First-mention order is a proxy for rank. Answers are prose; “mentioned earlier” is not always “recommended more strongly,” though in list-style answers they usually coincide. We did not parse explicit numbered rankings separately.
- Tau is conditional on shared membership (3+ brands). It says nothing about the brands that churned out of the pair — that’s the main study’s territory. The two statistics are complements, not substitutes; use both. The selection effects this creates are quantified in the section above: real, small, headline-preserving.
- Same scope as the parent study: one intent (headphones as a travel gift), ChatGPT via DataForSEO’s scraper (anonymous, free-tier, no personalization), en-US, one week, web search forced. The chance-baseline result depends on this market’s concentration; a category with a less dominant opener would have a lower chance rate.
- “First public coefficient” is a claim about our awareness, not a literature review. If someone has published a rank-stability coefficient for AI recommendations, we’d genuinely like to see it and will link it here.
What this means if you track a brand
- Read ordered AI answers as meaningful, but read the top slot as weather. The middle of the ordering carries real signal about how the model sorts the market. The lead position, across the phrasings your customers actually use, is close to a coin flip weighted by each brand’s overall share of first mentions.
- “We dropped from #1 to #3” is usually not news. Unless it’s the same prompt, same platform, and it persists across runs, a lead-slot change is consistent with pure phrasing noise. A brand leaving the set is news — that’s the stable layer changing.
- Rank-tracking dashboards inherit both properties. Averaged over a diverse panel, mean position is informative; any single prompt’s #1 is not. This is the same variety-over-repetition logic as the parent study’s pulse model, applied one level down.
Data and reproducibility
- Dataset: the same derived-features dataset (CC BY 4.0) as the parent study — the
brands_recommendedcolumn preserves first-mention order, so every number here is recomputable from the public file. - Analysis code:
94_exploratory_rank_stability.pyin the experiment 002 pipeline (the9xseries is labeled exploratory, outside the frozen00–05chain). - Parent study: We pre-registered “prompt phrasing barely matters.” ChatGPT proved us wrong. — pre-registered spec, decision rules, and the membership-level results this analysis conditions on.
- Methodology: research.spyglasses.io/methodology
Changelog
- 2026-07-24: published, incorporating reader-raised robustness checks (excluded-pair concordance, per-prompt concentration) before release.