

We tested our own prompt generator against 143 humans. It measures your home field, and we found what a market-matching panel needs.
Key findings
- Two different instruments were hiding inside “synthetic prompt tracking,” and they answer different questions. A panel generated from a brand’s own website measures that brand’s home field — the buying situations its positioning claims. A neutral, scenario-generated panel is the candidate instrument for measuring the market. Conflating them is where the industry’s credibility problem lives.
- The brand-anchored panels fail the market test at every layer. Prompts from our own production generator (anchored on bose.com and soundcore.com) produced answers that overlap human-prompt answers 0.12–0.23 Jaccard less than differently-worded human prompts overlap each other, and brand-share vectors off by 25–26 points on average — five times our pre-registered band. Swapping the anchor moves the measured Bose-vs-Anker gap by 41 points (DiD +0.411 [+0.189, +0.638]), and the mechanism is rival suppression, not self-flattery: the Bose-anchored panel shows Anker at half its human-panel visibility.
- The home-field reading is real, and it does not flatter you — which is what makes it useful. Reweighting the human panel to the Bose panel’s content mix reproduces ~72% of its share gap: ask the brand’s questions and humans see nearly the brand’s market. Yet Bose ranks second, behind Sony, on every panel including its own. Winning on your home field is the expected outcome; losing on your home field is the alarm — the most actionable number this kind of tracking produces.
- A neutral scenario panel passes the response test — and when sub-intents match, it matches humans completely. Its prompts are individually indistinguishable from human phrasings (brand-overlap gap −0.04, inside our band); its panel mix still misses shares by 11 points. But conditioned on sharing a sub-intent (travel framing, a named recipient), neutral-prompt answers are statistically equivalent to human-prompt answers — the entire remaining gap looks like sub-intent mix, not authorship.
- That is a recipe, and we are pre-registering the test. If a scenario generator’s output is stratified to the human panel’s sub-intent profile — the thing our Mad-Libs clause design was built to do — the data here says it should mirror the human panel at both the response and the share level. Experiment 005 tests exactly that, panels frozen before collection, whatever the result.
Why we asked
The sharpest critics of AI-visibility tools argue that synthetic prompt tracking can’t reflect real human usage, so its share-of-voice numbers describe nothing. David McSweeney’s widely shared list of 31 methodology questions for vendors puts it concretely: how were tracked prompts shown to resemble the population’s (Q3)? Can prompt selection determine the result (Q6)? Does volume substitute for representativeness (Q7)? What does synthetic prompt text actually represent (Q17)? SparkToro’s original study lands the same caution from the data side: real people phrase the same question in wildly different ways, so a tracked prompt sample may generalize to nothing beyond itself. The burden of proof, both argue, is on the vendors making the positive claim.
We agree about the burden. So we pointed the test at ourselves.
In our previous study we re-ran SparkToro’s 143 human survey prompts — real people’s own words for one commercial intent, headphones as a travel gift — and measured how much phrasing moves ChatGPT’s answers. That gave us something rare: a contemporaneous human baseline with known within- and between-prompt geometry. This study runs the next comparison. If you swap the human panel for a synthetic one — the panels an AI-visibility product actually generates — do you still measure the same market?
Four panels ran side by side, same platform, same five days:
- hum — the 143 human survey prompts, re-run fresh (never compared against last month’s responses, which came from the same model era but a different week);
- spy_a — 37 prompts from the production Spyglasses generator pointed at bose.com (the incumbent);
- spy_b — 37 prompts from the same generator pointed at soundcore.com (Anker’s mid-tier brand);
- neu — 40 prompts from a neutral generator given only the buying scenario, no brand context;
- plus 40 cross-intent control prompts (coffee-shop branding agencies) to gate the pipeline.
The generator is the real one our customers use: it crawls the brand’s site, builds a snapshot (category, segments, features, differentiators), and composes queries through marketing frameworks — jobs-to-be-done, category entry points, buyer’s journey, stakeholder perspectives. The two anchors give the anchor-bias question (Q6) a clean difference-in-differences design: whatever is generic about the generator cancels; whatever follows the anchor shows up as a relative tilt.
Methods in brief
1,325 runs evaluated in this study: 257 headphone-panel prompts × 5 daily waves plus the 40-prompt control × 1, collected 29 July – 2 August 2026 via DataForSEO’s LLM scraper (en-US, web search forced, model gpt-5-5 throughout — not the logged-in consumer product). From each answer we extracted recommended brands (frozen alias lexicon, identical to the previous study’s), cited source domains, and grounding-query tokens.
Three pre-registered hypotheses, all with 90% prompt-cluster bootstrap CIs and TOST-style equivalence logic. H1 (exchangeability): does a synthetic prompt’s answer overlap a human prompt’s answer as much as two different human prompts overlap each other? Equivalence band 0.10 Jaccard. H2 (share agreement): does each panel’s brand-share vector match the human panel’s within 5 points on average, over the six brands the human panel mentions in at least 5% of answers? H3 (anchor bias): three directional statistics, with the Bose-vs-Soundcore difference-in-differences as the primary carrier. A fourth, descriptive layer (H4) codes every prompt with 15 phrasing flags — budgets, recipients, use cases, form factors, output-format requests — and compares coverage. Everything was frozen before wave one: pre-registered spec at 8ab4519, analysis code.
The positive-control gate passed (same-intent pairs cite far more similar domains than cross-intent pairs, Δ = 0.295 [0.262, 0.327], permutation p = 0.0002 — nearly identical to last month’s 0.289) and the placebo split came back null (0.001 [−0.005, 0.009]). The human baseline itself replicated: between-prompt brand overlap 0.528 vs July’s 0.537, within-prompt 0.724 vs 0.736. The instrument is stable; what follows is not measurement noise.
Result 1: the anchored panels measure a different market
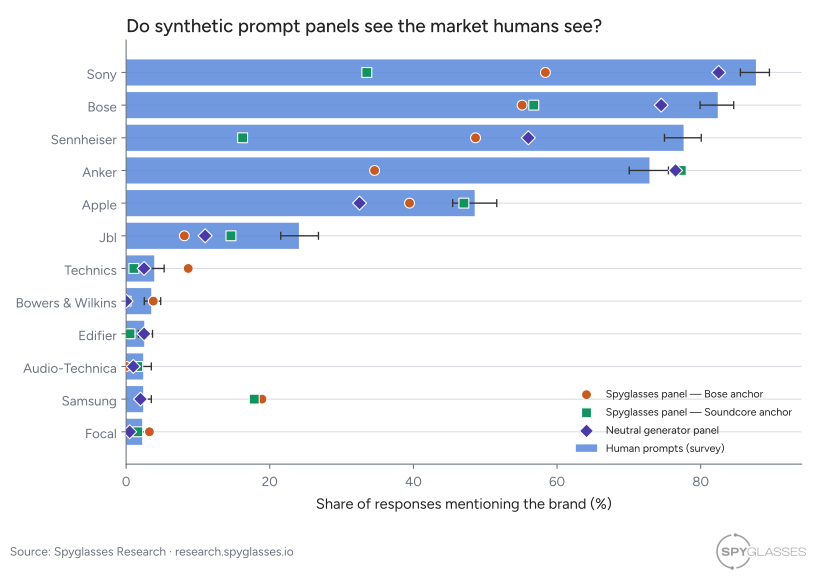
Share of answers mentioning each brand: human-panel bars (with 90% intervals) vs each synthetic panel’s markers, pooled over the 5 waves evaluated in this study. The anchored panels’ markers sit far off the human bars; the neutral panel’s sit close.
Both brand-anchored panels fail exchangeability on all three artifact families. A spy_a prompt’s answer overlaps a human prompt’s answer 0.200 [0.134, 0.266] less on brands than two human prompts overlap each other; 0.123 less on cited domains; 0.197 less on grounding-search tokens. For spy_b the gaps are 0.228, 0.170, and 0.234. Every interval sits wholly beyond the 0.10 band we froze in advance. This isn’t “the panel’s average is off” — each individual anchored prompt lands measurably outside the response distribution that human phrasings produce.
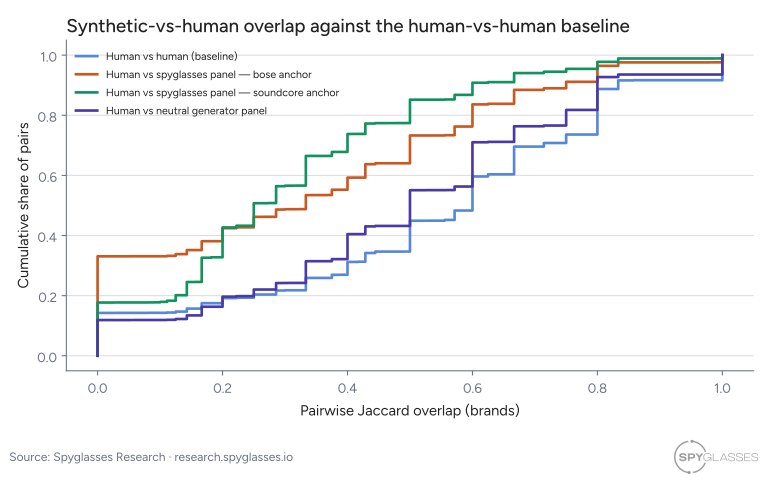
Cumulative distribution of pairwise brand overlap between human answers and each panel’s answers, against the human-vs-human baseline (blue). The neutral panel (purple) hugs the baseline; the anchored panels don’t.
The share vectors follow. Over the six-brand basket, spy_a’s shares differ from the human panel’s by 0.248 [0.174, 0.325] on average and spy_b’s by 0.261 [0.225, 0.317] — both five times the 5-point band, both CIs entirely above it. And the two panels fail differently. spy_a keeps the human ranking (tau 0.867) while depressing the levels. spy_b scrambles the ranking itself (tau 0.200): Sony appears in 33.5% of its answers versus the human panel’s 87.7%, Sennheiser in 16.2% versus 77.6%, while Samsung — which humans surface in 2.4% of answers — jumps to ~18% on both anchored panels. A marketer reading the Soundcore-anchored panel is looking at a genuinely different market.
We state the equivalence bounds plainly because they are the claim: we could have detected agreement within 0.10 Jaccard and 5 share points. We found multiples of both.
Result 2: swap the anchor, move the leaderboard
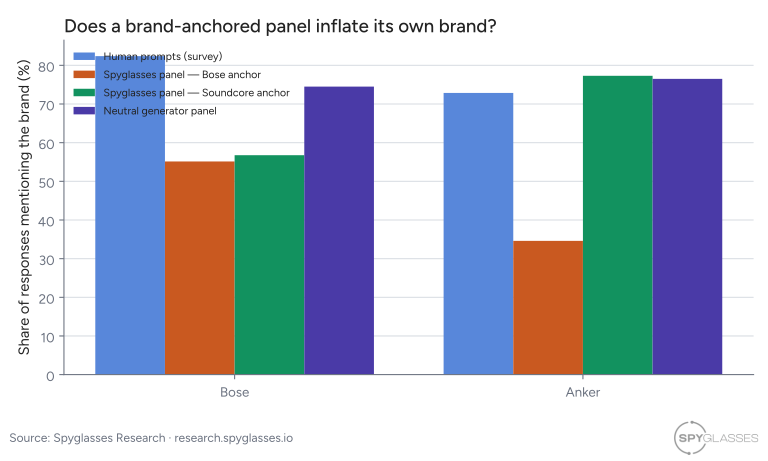
The H3 carrier: each anchor brand’s share across the four panels. The panels roughly tie on Bose — but the Bose-anchored panel shows Anker at half its human-panel share.
Does pointing the generator at your own site inflate your measured share? The difference-in-differences says the anchor decides the competitive picture: re-anchoring from Soundcore to Bose moves the measured Bose-vs-Anker gap by +0.411 [+0.189, +0.638]. That’s the answer to Q6, and it’s not subtle — panel configuration alone repaints a 41-point stretch of the scoreboard.
But the decomposition matters more than the headline. Neither panel inflates its own anchor above the human baseline: spy_a actually shows Bose 27 points below the human panel’s 82% (its panel depresses all brand mentions — more on that below), and spy_b shows Anker within noise of the human level. The bias lives on the rival’s side. The Bose-anchored panel surfaces Anker in 34.6% of answers against the human panel’s 72.9%; the Soundcore-anchored panel returns the favor against Sennheiser and Sony. An anchored panel doesn’t flatter you; it blinds you to your competitors. If you read “we’re beating brand X” off a panel anchored on your own site, X’s number — not yours — is the one most likely to be wrong.
Result 3: the neutral panel — fluent prompts, wrong mix
The scenario-only panel is the study’s most instructive contrast. On response content it is practically equivalent to human phrasing: brand-overlap gap −0.041 [−0.085, 0.002] and domain gap −0.030 [−0.062, 0.001], both inside the band — a fluent, same-intent prompt lands in-distribution even though no human wrote it. (Its grounding-token gap, −0.084 [−0.118, −0.050], is detectable and modest; and a rank-sensitive robustness check finds a small ordering divergence, −0.070 [−0.110, −0.032]. We report both.)
And yet its panel-level shares still miss by 0.112 [0.082, 0.157] — more than twice the band. This is the exact dissociation we pre-registered as the scenario to watch (McSweeney’s Q3-versus-Q7 distinction): every prompt individually plausible, the mix still unrepresentative. No amount of per-prompt quality fixes a sampling frame, and no amount of volume does either — running an unrepresentative panel more often estimates the wrong number more precisely.
The phrasing-coverage layer (Q17) says why the mixes drift. Human prompts run a median of 30 words (range 3–274); the synthetic panels run 11–16 with a standard deviation near 3 — short and uniform, where humans ramble, name a recipient and their age, state a dollar budget, ask for “top 5 with reviews,” and mention watching movies on the plane. Several of those behaviors never occur in any synthetic panel. Each panel reproduces only 5–8% of the distinct phrasing profiles the human panel contains. Synthetic prompts are also noisier run to run: the same prompt re-asked on different days agrees with itself 0.09–0.11 less than human prompts do, across all three panels — they sit in a less stable region of the response space.
If the mix is the failure, an obvious question follows: what happens when the mix does match? The exploratory section below takes that apart — and it’s where this study turns from an audit into a recipe.
Exploratory: home fields, and the path to a market-matching panel
Everything in this section is post-hoc, exploratory, and labelled as such — computed after we read the pre-registered results, logged in the spec’s deviations, with small effective samples. Treat it as strong hypothesis generation.
What an anchored panel actually measures
Three observations kept pointing the same direction. First, a quarter of spy_a’s answers contain no recommended brands at all (25.4%, versus 5.7% for human prompts) — ten of its 37 prompts, concentrated in the category-entry-point and buyer’s-journey-awareness frameworks, consistently draw long informational answers with nothing brand-shaped in them. Those are awareness-stage questions by design, and the Spyglasses product already excludes that funnel stage from share of voice; restricting the panels to decision-stage prompts closes about a third of spy_a’s share gap (0.248 → 0.162) — and none of spy_b’s (0.261 → 0.280), while the anchor effect concentrates (DiD +0.571 [+0.306, +0.822] on that subset). Funnel stage explains a slice, not the story.
Second, the generator’s brand snapshots document exactly what got encoded. Bose’s snapshot lists noise cancelling, wireless, battery life, and segments like frequent flyers and commuters. Soundcore’s — built from a homepage-only crawl — lists its product lines: open-ear clip earbuds, sleep earbuds, workout earbuds. The panels’ phrasing tilt mirrors the snapshots one for one: spy_b mentions a form factor in 78% of its prompts versus 11% of human prompts, and both anchored panels largely drop the travel-gift scenario the humans were actually answering.
Third — the test that ties it together — we reweighted the human panel so its content mix matches each anchored panel’s (raking on the four most divergent phrasing flags), and asked: if humans posed this panel’s mix of questions, would they see this panel’s market?
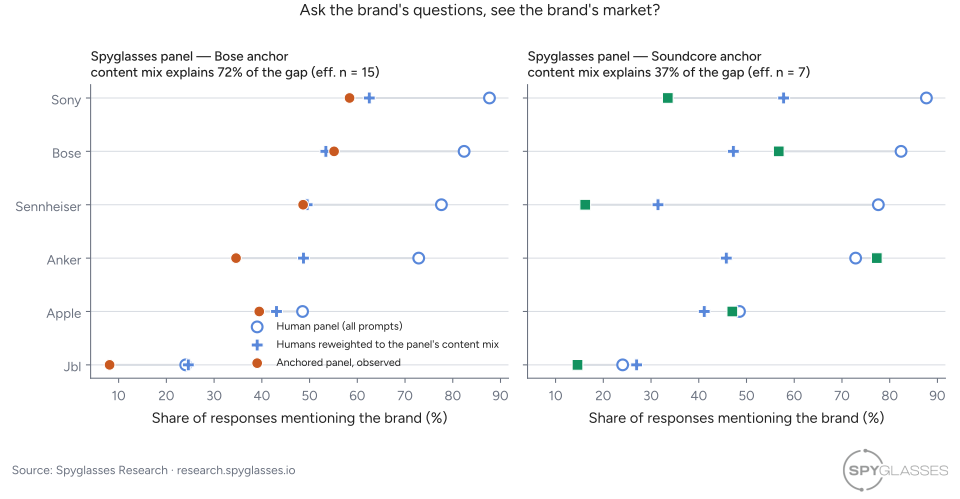
Reweighting human prompts to each anchored panel’s content mix. For the Bose anchor, humans asked the panel’s questions see nearly the panel’s market (72% of the gap explained); for the Soundcore anchor, content mix explains 37%. Effective samples are small (15 and 7 of the 143 human prompts in this study) — exploratory.
For the Bose panel, largely yes: reweighting closes 72% of the share gap (MAD 0.248 → 0.068), putting the reweighted human panel nearly on top of the observed one — Sony 62.5% vs 58.4%, Bose 53.4% vs 55.1%, Sennheiser 49.5% vs 48.6%. The mechanism replicates at the single-flag level, too: human prompts that state a dollar budget drop Bose 25 points and lift JBL 32, almost exactly the budget flip our previous study found on July’s data. Prompt content steers brand mix; the anchored panel is a machine for producing a particular content mix.
For the Soundcore panel, only partly: 37% explained, on an effective sample of just 7 human prompts — because almost no human phrases the travel-gift question as a workout-earbuds question. That panel’s mix doesn’t tilt within human phrasing space; it mostly leaves it.
So the fair reading of an anchored panel is neither “market census” nor “garbage.” It is your home field: your visibility within the buying situations your own positioning claims. And the data shows the instrument doesn’t flatter you there:
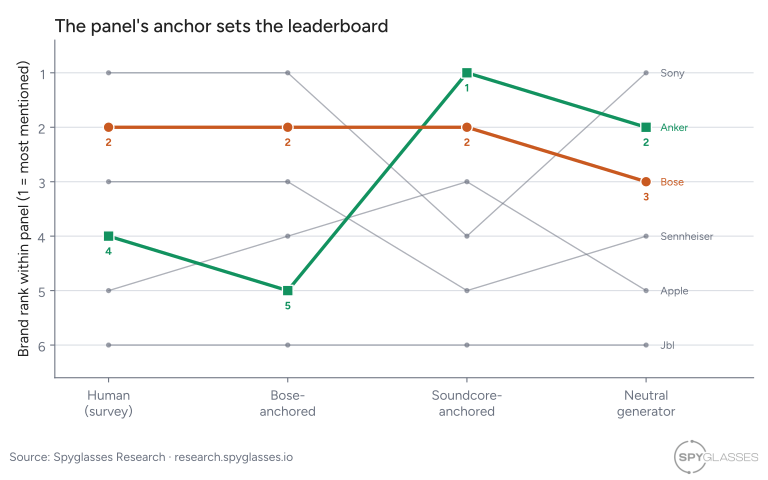
Brand rank within each panel’s six-brand basket. Anker swings from 1st on its own panel to 5th on its rival’s; Bose never overtakes Sony, even on the panel anchored to bose.com. Exploratory.
Bose trails Sony on every panel including the one generated from bose.com. Anker ranks 1st on its own panel and 5th on its rival’s. Which yields the practical asymmetry: winning on your home field is the expected outcome — read it with the conditional label. Losing on your home field is the finding that should reorganize your week.
Does matching the sub-intent close the gap?
During review we ran one more cut, prompted by a hypothesis from the phrasing study: human prompts sharing a sub-intent (a budget, a travel frame, a use case) converge on brands and sources. If the synthetic panels’ remaining gap is just sub-intent mix, then a synthetic prompt and a human prompt that share a sub-intent should produce answers as similar as two humans sharing it. We conditioned the human-vs-synthetic pair overlap on whether both prompts carry the same phrasing flag, against the human-vs-human same-flag baseline:
| Flag matched | Panel | Prompts | Human×human | Human×synthetic | Gap [90% CI] |
|---|---|---|---|---|---|
| travel | neutral | 30 | 0.566 | 0.526 | −0.039 [−0.086, +0.003] — equivalent |
| recipient | neutral | 29 | 0.419 | 0.417 | −0.002 [−0.077, +0.055] — equivalent |
| noise-cancelling | Bose-anchored | 9 | 0.558 | 0.355 | −0.203 [−0.352, −0.063] — residual gap |
| travel | Soundcore-anchored | 8 | 0.566 | 0.445 | −0.121 [−0.238, −0.018] — residual gap |
| noise-cancelling | Soundcore-anchored | 5 | 0.558 | 0.309 | −0.249 [−0.416, −0.092] — residual gap |
For the neutral panel, matching the sub-intent closes the gap completely: on its two dominant frames, neutral-prompt answers are statistically equivalent to human-prompt answers (and mismatched pairs are the drag — travel-matched pairs overlap at 0.526 vs 0.435 for mismatched). Authorship doesn’t matter; the sub-intent does. For the anchored panels, matching a single flag is not enough — most matched cells keep a real residual, because anchored prompts stack the anchor’s whole content bundle, so agreeing on one clause still mismatches the rest of the profile.
Same caveats as everything in this section, doubled: post-hoc, single-flag conditioning, cells as small as 5 prompts, no multiplicity correction. But the direction is consistent everywhere we can measure it, and it makes a specific, falsifiable prediction — which brings us to what happens next.
What we can and cannot claim
- Scope, always: one intent (headphones as a travel gift), one platform (ChatGPT via DataForSEO’s LLM scraper — not the logged-in consumer product), one locale (en-US), five days, web search forced, model
gpt-5-5throughout. Nothing here licenses claims about other intents, platforms, or personalized sessions. - One draw per configuration. Generation is one-shot, as it is for a real customer; our conclusions are about the panels this generator produced, not the generator’s distribution. The two anchors double as partial replicates, and they diverged from the humans in the same direction.
- Raw generator output, not curated panels. Customers review and edit generated prompts; we tested the untouched draw. Curation could narrow the gap — that’s a testable follow-up, not an assumption.
- Single-turn on both sides. The human prompts are survey-elicited single-shot phrasings; nobody’s panel here captures multi-turn conversational research.
- Pre-registered vs exploratory is marked throughout. H1–H3 verdicts follow the decision rule frozen before collection. The funnel-stage subset, the reweighting analysis, the rank-swing reading, and the sub-intent matching pilot are post-hoc, small-sample, and labelled.
- Extraction is audited. The brand extractor recovered 100% of the scraper’s own brand-entity annotations where present, and a 30-response manual spot-check passed the pre-registered precision/recall thresholds.
What this means if you track a brand in AI answers
- Know which instrument you’re reading. A panel generated from your site is a home-field instrument; a scenario-generated panel is a market instrument. They disagree by design, not by accident — ask your vendor which one your dashboard shows.
- Treat anchored share of voice as home-field share of voice. It measures the conversations your positioning claims — a real and useful quantity, but not the market, and it should never be reported without the label.
- Never read competitive gaps off a panel anchored on yourself. The bias concentrates on your rivals’ numbers, not yours. If the competitive gap is the question, use a neutral, scenario-generated panel — in this study, the panel whose individual prompts were statistically indistinguishable from human phrasing.
- The alarm signal is asymmetric. Expect to look strong on your own panel; it’s built from your strengths. If you still trail a competitor there — as Bose trails Sony here — that’s the most actionable number this kind of tracking can produce.
- Volume doesn’t fix a frame; matching might. Running more prompts from the same generator samples the same frame more densely. The pilot above says the fix is matching the sub-intent mix — which is a generation-time design choice, and the subject of our next experiment.
Next: the market-matching recipe, pre-registered
This study is of our own product, so it ends with obligations, not a victory lap. Spyglasses already excludes awareness-stage prompts from share-of-voice scoring; based on these results we are moving panel generation toward the scenario-first frame the neutral arm validated, labelling anchored-panel share of voice as home-field in the product, and adding phrasing diversification targeted at the human behaviors no generator emitted.
And the data here makes a prediction specific enough to bet on. If the neutral panel’s only failure is its sub-intent mix, then a scenario generator whose output is stratified to the human panel’s sub-intent profile — budgets, recipients, use cases, form factors, in human proportions — should mirror the human panel at both the response level and the share level. That’s what our Mad-Libs clause design was originally built for. Experiment 005 tests it: same platform, same human baseline re-run contemporaneously, a profile-stratified scenario panel against an unstratified replication arm, hypotheses and panels frozen before collection (design sketch). If it passes, synthetic panels have a defensible recipe for representing human intent — the constructive answer to both McSweeney’s Q3 and SparkToro’s caution. If it fails, the residual is the next thing to name and measure. Either way, we’ll publish the number.
Data and reproducibility
This study exists because SparkToro (Rand Fishkin) designed the original survey and shared their de-identified prompts. The human prompt text is theirs and is not ours to publish — researchers should contact SparkToro directly.
The synthetic side, we can publish — all of it:
- Runs dataset: Synthetic vs human prompt panels on ChatGPT (derived features) (CC BY 4.0) — one row per run evaluated in this study: panel, brands, cited domains, counts. Column dictionary in the datasheet.
- Prompt text: the full text of all 114 synthetic prompts (CC BY 4.0), verbatim, with generation-framework labels — released so anyone can re-run our panels and check us. (Datasheet.) The equivalent prompt styles are reproducible with our free prompt generator.
- Pre-registered spec: frozen at
8ab4519; all deviations logged in the current spec. - Analysis code: experiments/003-synthetic-prompt-coverage/ — stages
00–05are the pre-registered pipeline;90–91are the labelled exploratory extensions. - Methodology: how we design and report every study — research.spyglasses.io/methodology
To the burden-of-proof argument, this is our answer for Q3, Q6, Q7, and Q17: measured, pre-registered, self-implicating where the data said so, with the instruments published and the constructive path pre-registered next. To other vendors: the human baseline is obtainable, the method is documented, and the comparison is uncomfortable but survivable. Publish your number.
Changelog
- 2026-08-02: published.