
A synthetic panel matched to human sub-intent reproduces the consideration set — but not the share of voice.
Key findings
- A synthetic prompt is now interchangeable with a human one. Prompts generated to match the human panel’s sub-intent profile produced answers that overlap human-prompt answers 0.516 — against a human-vs-human baseline of 0.517. On cited sources, 0.306 vs 0.308. That is the closest match to human phrasing we have measured, and it holds inside matched sub-intents too, confirming a prediction we made from cells as small as 5 prompts.
- The panel’s brand-share vector still missed by 8.9 points (band: 5), so the recipe we pre-registered did not fully work. But “missed the shares” turns out to describe something narrower than it sounds.
- The disagreement is about frequency, not membership. Both panels surface the same brands in nearly the same order (rank correlation 0.87). Within the travel sub-intent, 82% of human prompts and 72% of synthetic prompts surface Apple at least once — but 9.5% versus 0% surface it in all five runs. The panels agree on who competes and disagree on how often each one shows up.
- It is not a mix problem and not a noise problem. Holding the sub-intent fixed does not shrink the gap (0.085 within travel vs 0.089 unconditional), so a client supplying its own sub-intents would not fix it. And synthetic prompts proved as self-consistent as human prompts when re-run — which contradicts what we published four days ago.
- We could not replicate our own robustness finding. Our previous study measured all three of its synthetic panels as materially noisier run-to-run than the human panel. Here both synthetic arms come back statistically indistinguishable from it. We report the non-replication because a program built on pre-registration has to publish the numbers that cut against it first.
Why we asked
Four days ago we published a bet. Having found that brand-anchored prompt panels measure a brand’s home field rather than its market, we argued the fix was specific and testable:
If a scenario generator’s output is stratified to the human panel’s sub-intent profile — budgets, recipients, use cases, form factors, in human proportions — the data says it should mirror the human panel at both the response level and the share level.
That prediction came from a post-hoc pilot on cells as small as 5 prompts, which is exactly the kind of result that evaporates under a real test. So we pre-registered the real test, froze the panels before collecting a single answer, and committed to publishing whatever came back.
The stakes are not academic. Every AI-visibility product, ours included, reports numbers computed over a panel of prompts that no human wrote. David McSweeney’s 31 methodology questions asks vendors to show that their tracked prompts resemble the population’s (Q3) and that volume is not being substituted for representativeness (Q7). SparkToro’s research makes the same point from the data side. If a synthetic panel can be made to stand in for a human one, that is a concrete answer. If it cannot, the honest move is to say what it can and cannot stand in for.
Three panels ran side by side on the same platform for the same five days:
- hum — SparkToro’s 143 human survey phrasings for one commercial intent (headphones as a travel gift), re-run fresh so nothing is compared across weeks;
- mat — 55 scenario-generated prompts stratified to the human panel’s joint profile across six sub-intent dimensions (travel context, music use, budget, named recipient, form factor, wireless), with prompt lengths drawn from the human distribution;
- neu2 — 40 scenario-generated prompts from the same generator with no stratification, an exact replication draw of the previous study’s neutral arm;
- plus 40 cross-intent control prompts to gate the pipeline.
The stratified panel was generated once, by regenerate-until-valid, and never hand-edited — the same one-shot process a customer would get.
Methods in brief
1,230 runs evaluated in this study: 238 headphone-panel prompts × 5 daily waves plus the 40-prompt control × 1, collected 2–6 August 2026 through DataForSEO’s LLM scraper (en-US, web search forced, model gpt-5-5 throughout — not the logged-in consumer product). From each answer we extracted recommended brands using a frozen alias lexicon, cited source domains, and grounding-query tokens. Total collection cost: $2.95.
Four pre-registered hypotheses, all with 90% prompt-cluster bootstrap intervals and TOST-style equivalence logic, frozen at 80e6c09 before wave one:
- H1 (exchangeability): does a synthetic prompt’s answer overlap a human prompt’s answer as much as two different human prompts overlap each other? Band: 0.10 Jaccard.
- H2 (share agreement): does the panel’s brand-share vector match the human panel’s within 5 points on average, across the brands humans mention in at least 5% of answers?
- H3′ (matched sub-intent): the pilot, now pre-registered — restrict to pairs where both prompts carry the same sub-intent flag.
- H4 (coverage, descriptive): code every prompt with 15 phrasing flags and compare.
We also registered five predictions in public. Three held; the central one did not.
| # | Registered prediction | Outcome |
|---|---|---|
| 1 | The stratified panel passes H1 | Confirmed — −0.001 on brands |
| 2 | The stratified panel passes H2 | Falsified — 0.089 against a 0.05 band |
| 3 | The unstratified panel passes H1 on brands and sources | Split — sources yes, brands landed just outside |
| 4 | The unstratified panel fails H2 | Confirmed — 0.137 |
| 5 | Matched sub-intents come back equivalent | Confirmed — travel −0.009, music −0.038 |
The positive-control gate passed (same-intent pairs cite far more similar sources than cross-intent pairs, Δ = 0.306 [0.274, 0.338], permutation p = 0.0002) and the placebo split was null (−0.003 [−0.008, 0.005]). The human baseline replicated a third time: between-prompt brand overlap 0.517 here versus 0.528 and 0.537 in the two prior studies, and human brand shares tracked the previous study within about 3 points. A manipulation check confirmed the stratified panel hit all twelve of its target sub-intent cells exactly.
Result 1: the synthetic prompts are indistinguishable from human ones
This is the cleanest exchangeability result in the program, and it beat our own prediction.
| Artifact | Human × human | Human × stratified | Difference [90% CI] |
|---|---|---|---|
| Recommended brands | 0.517 | 0.516 | −0.001 [−0.038, +0.037] |
| Cited sources | 0.308 | 0.306 | −0.001 [−0.030, +0.026] |
| Grounding queries | 0.288 | 0.233 | −0.054 [−0.082, −0.028] |
Pick a synthetic prompt and a human prompt at random and compare the two answers: they agree exactly as much as two differently-worded human prompts agree with each other. The equivalence band was 0.10; the estimate is 0.001.
Restricting to pairs where both prompts carry the same sub-intent tightens it further — travel −0.009 [−0.051, +0.030] across 46 prompts, music −0.038 [−0.088, +0.009] across 41. The pilot that motivated this study replicated at eight times the sample size.
Two honest qualifications. The grounding-query contrast sits inside the band but its interval excludes zero, so the panel searches slightly differently even when it answers the same. And the unstratified panel’s brand contrast came back at −0.055 [−0.106, −0.006] — the point estimate is close to the −0.041 we measured last month, but the interval spills just past our band, so by the rule we froze it counts as a real difference rather than equivalence. It is a borderline interval landing on the other side of a threshold, not a reversal.
Result 2: the share vector still misses
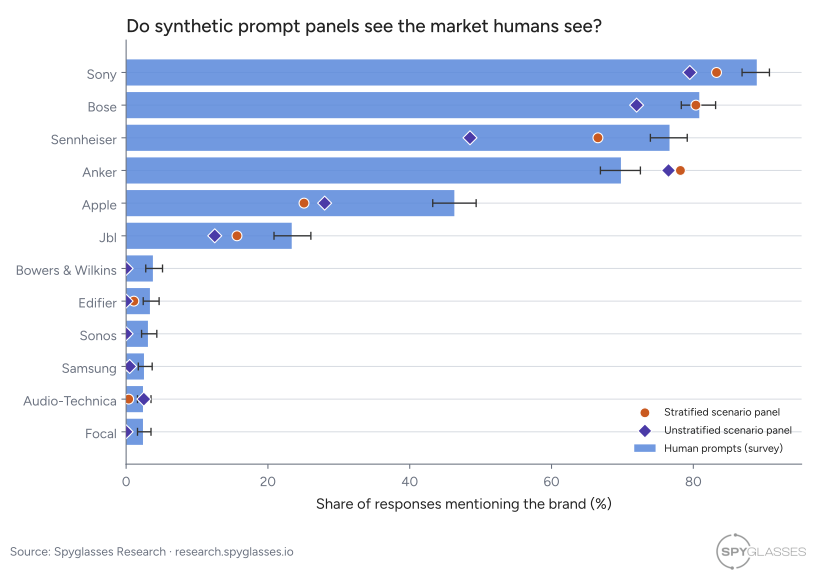
Share of answers mentioning each brand: human-panel bars (with 90% intervals) against each synthetic panel’s markers, pooled over the five waves evaluated in this study.
Averaged across the six brands humans mention most, the stratified panel is 8.9 points off [7.1, 12.5] — better than the unstratified panel’s 13.7 and better than the previous study’s neutral panel at 11.2, but well outside the 5-point band we committed to. The prediction failed.
| Brand | Human | Stratified | Difference |
|---|---|---|---|
| Sony | 89.0% | 83.3% | −5.7 |
| Bose | 80.8% | 80.4% | −0.5 |
| Sennheiser | 76.6% | 66.5% | −10.1 |
| Anker | 69.8% | 78.2% | +8.4 |
| Apple | 46.3% | 25.1% | −21.2 |
| JBL | 23.4% | 15.6% | −7.7 |
Stratification bought real ground — Bose lands within half a point, and Sennheiser’s 28-point miss on the unstratified panel shrinks to 10 — but Apple alone accounts for 40% of the total deviation, and the panel under-mentions five of six brands while over-mentioning Anker.
The equivalence bound is the claim: we could have detected agreement within 5 share points, and the best panel missed by 8.9.
Result 3: what the miss actually is
Everything from here is post-hoc and labelled as such. It is also the part that changed how we read the pre-registered result.
A share figure pools a yes/no per answer, which means “off by 8.9 points” can describe two very different failures. Either the synthetic panel surfaces different brands, or it surfaces the same brands at different rates. Splitting the statistic answers it.
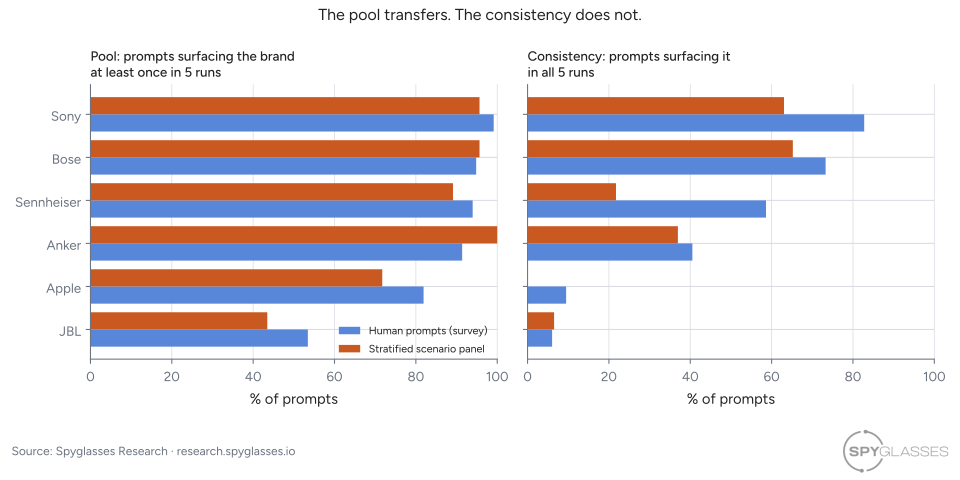
The same six brands, split two ways, within the travel sub-intent evaluated in this study. Left: does this prompt surface the brand at all? Right: does it surface the brand every time?
Within the travel sub-intent, the panels agree on which brands belong. Counting the prompts that surface a brand at least once across their five runs: Sony 99% of human prompts and 96% of synthetic ones; Bose 95% and 96%; Sennheiser 94% and 89%; Anker 91% and 100%. Even Apple, the worst case, is 82% versus 72%. Both panels return the same six-brand consideration set, in nearly the same order — the rank correlation between the two share vectors is 0.87.
They disagree on how often. Apple comes back in all five runs for 9.5% of human prompts and 0% of synthetic ones. Sennheiser: 59% versus 22%. Among prompts that surface Apple at all, humans get it in 55% of runs and the synthetic panel in 37%.
That is a meaningfully different result from “synthetic panels see a different market.” They see the same market and report it at different volumes.
Ruling out the two easy explanations
It is not the panel mix. The obvious reading of a share gap is that the panel asks a different distribution of questions. If so, holding the sub-intent fixed should close it. It does not: within travel the gap is 0.085, within music 0.110, against an unconditional 0.089.
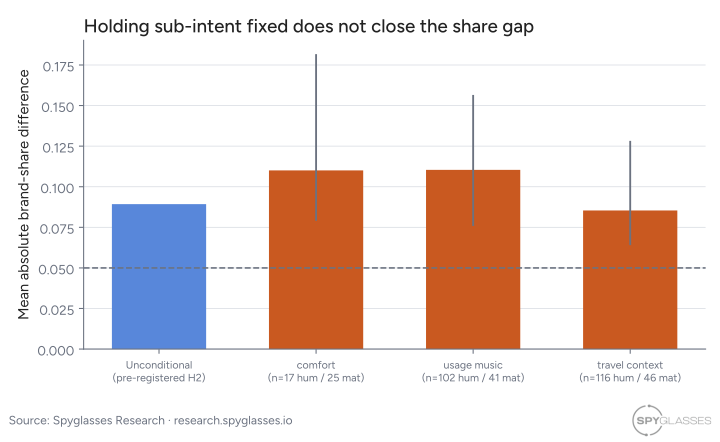
Mean absolute brand-share difference, unconditional and restricted to prompts carrying the same sub-intent flag, with 90% intervals and the pre-registered 0.05 band.
This matters commercially. The natural workaround is to have a brand name the sub-intents it cares about and generate prompts for those, sidestepping the need to estimate a mix. The data says that would produce a realistic consideration set and still not a trustworthy percentage.
It is not noise, and this test was pre-registered. A synthetic prompt re-run five times is exactly as self-consistent as a human prompt re-run five times: −0.038 [−0.086, +0.009] for the stratified panel and −0.018 [−0.060, +0.029] for the unstratified one, both null against a 0.10 band.
That is a non-replication of our own study. Last month we measured all three synthetic panels as materially noisier than humans — −0.104, −0.111 and −0.089, every one a real difference — and concluded synthetic prompts “occupy a less stable region of the response space.” This study’s unstratified panel is an exact replication draw of that generator and lands at −0.018, while the human baseline barely moved (0.724 to 0.704). The two studies’ intervals overlap in the −0.060 to −0.039 range, so they are not statistically distinguishable and this is a non-replication rather than a refutation. What does not survive is the general claim that synthetic prompts are inherently flakier.
With mix and noise both excluded, what remains is a systematic shift in what synthetic phrasing surfaces — consistent in direction in every stratum we can measure: Apple down 17 to 19 points, Sennheiser down 13 to 18, Anker up about 6.
How far the panel drifts depends on where a brand sits in the ranking. Expressed as error relative to each brand’s own human share, rather than in absolute points:
| Brand | Rank in the human panel | Relative error |
|---|---|---|
| Bose | 2 | −0.6% |
| Sony | 1 | −6.4% |
| Anker | 4 | +12.0% |
| Sennheiser | 3 | −13.2% |
| JBL | 6 | −33.1% |
| Apple | 5 | −45.8% |
Below this basket it degrades further, and not in one direction. Four brands that human prompts surface in 1.5–3.8% of answers never appear in the stratified panel at all (Bowers & Wilkins, Sonos, Focal, Beyerdynamic), while Shokz appears 2.6× more often than in human answers (1.8% → 4.7%) and Technics somewhat more (2.2% → 2.9%). The accurate statement is not that synthetic panels under-surface the alternatives — it is that outside the top few brands, a synthetic panel’s per-brand number stops being reliable in either direction.
Where the residual lives
The stratification worked precisely where it was applied and bought nothing anywhere else. Measuring how far each panel’s phrasing sits from the human panel’s, across the six dimensions we matched versus the nine we did not:
| Panel | Six stratified dimensions | Nine unstratified dimensions |
|---|---|---|
| Stratified | 0.039 | 0.135 |
| Unstratified | 0.197 | 0.094 |
Matching cut error five-fold on its targets and left the rest untouched. One dimension dominates the remainder: the stratified panel raises comfort in 45% of its prompts against the human panel’s 12% — an artifact of the clause template that hits the six targets. Excluding it, the two panels are effectively tied on the unstratified dimensions, so the honest statement is that constraining six dimensions did not improve the other nine, not that it degraded them.
The deeper limit is combinatorial. Human prompts in this study form 79 distinct phrasing profiles; the stratified panel reproduces 13% of them, the unstratified panel 8%. It never asks about watching films on a plane (31% of human prompts), the recipient’s age (10%), how many options to return (9%), or what format to answer in (4%). Matching six marginal rates does not reconstruct the joint distribution — and the answer depends on the joint.
What our own instrument got wrong
This study argues that measurement instruments mislead, so it owes you its own errors. We ran a blind audit: one reviewer labelled 30 answers by hand with the extractor’s output withheld, so the labels were generated independently rather than checked against ours.
On the raw comparison the extractor scored 88.0% precision — below the 95% we had committed to. Re-reading every disagreement against the source text resolved 11 of 14 in the extractor’s favour: they were brands the labelling had passed over, most of them sitting in comparison tables, parentheses, and secondary product headings rather than the main recommendation list. That puts the audited figures at 97.4% precision and 91.9% recall, above the frozen thresholds. Recall is measured against what a human noticed, so it is an upper bound. The three surviving errors, and one gap the audit found, are worth reporting.
Our extractor counts brands used as platforms. “A streaming subscription such as Apple Music” and “what phone does he use — Samsung Galaxy, Google Pixel” both register as brand mentions. This is differential: 5.0% of human answers carry a platform-only Apple reference versus 1.1% of the stratified panel’s. Restricting Apple to product aliases narrows its gap from −21.2 to −17.3 points and moves the headline from 0.089 to 0.083. Roughly 18% of the single largest number in this article is our artifact, and it biases in the direction that flatters our own conclusion.
One brand was missing from the lexicon entirely. JLab appears in 6.7% of human answers, above the 5% threshold for inclusion, so the comparison should have run over seven brands rather than six. Adding it moves the stratified panel to 0.078 and the unstratified panel to 0.119.
Both corrections push the same way, and neither changes a verdict: with both applied the stratified panel sits at 0.073 and the unstratified panel at 0.114, still well outside the 0.05 band. Because the lexicon was frozen before collection, we report these as corrections rather than re-running the analysis with a tuned instrument — adjusting your measuring device after seeing the results is the precise failure that pre-registration exists to prevent.
What we can and cannot claim
- Scope, always: one intent (headphones as a travel gift), one platform (ChatGPT through DataForSEO’s LLM scraper, not the logged-in consumer product), one locale (en-US), five days, web search forced, model
gpt-5-5throughout. Nothing here licenses claims about other intents, platforms, locales, or personalized sessions. - The equivalence bounds: we could have detected a 0.10 Jaccard shift in response overlap and found 0.001. We could have detected a 5-point share difference and found 8.9. No primary test returned an inconclusive interval.
- One draw per configuration. The panels were generated once, unedited, as a customer would receive them. Conclusions are about the panels this generator produced, not about the generator’s distribution.
- The recipe has a stated cost we did not escape. The stratification targets came from a human survey panel. Nothing here shows the method works for an intent with no human panel to copy — that dependency is the recipe’s price, and testing whether a neutral source can supply the targets is open work.
- We do not claim the frequency gap is closable. We did not measure how far two independent human panels sit from each other on the same intent, so we cannot say what “matching” at this layer would even mean as a target.
- Pre-registered and exploratory are marked throughout. The scorecard, H1, H2, H3′ and the robustness suite follow the rule frozen before collection. The pool/frequency split, the sub-intent conditioning, and the residual decomposition are post-hoc and labelled in place.
- Extraction is audited, and imperfect. See the section above; the known biases favour our own headline and are reported with their magnitudes.
What this means if you track a brand in AI answers
- A sub-intent-matched synthetic panel answers “who am I competing with for this use case, and roughly where do I stand?” On this evidence that answer is trustworthy: same brands, same rough order, individually human-equivalent prompts.
- It does not answer “what percent of the time do I appear?” The consideration set transfers; the percentage does not. If a dashboard reports a share-of-voice figure from a synthetic panel, treat the ordering as the signal and the number as soft.
- Naming your own sub-intents will not fix the percentage. It is an intuitive workaround and the data rules it out — holding the sub-intent fixed leaves the gap where it was.
- Synthetic prompts are not flaky. Re-run, they are as self-consistent as human prompts. The gap is systematic rather than random, which means more prompts will not average it away.
- Your number is least trustworthy if you are not a category leader. The top two brands came back within 6% of their human values; the fifth and sixth were off by 33% and 46%; several brands below them vanished from the synthetic panel entirely and one appeared 2.6× too often. Challenger brands should read their own figure with the widest error bars — and it can flatter as easily as it buries.
- Ask what a panel never asks. The generator here matched every dimension it was told to match and stayed silent on nine others — never mentioning films, the recipient’s age, or a requested answer format. Coverage of the combinations your buyers actually use is the thing to interrogate, and 13% is the number to beat.
Data and reproducibility
- Datasets: derived features for all 1,230 runs (CC BY 4.0, datasheet) and the full text of both synthetic panels (CC BY 4.0, datasheet) — 95 prompts, joinable to the runs file. The human survey phrasings are SparkToro’s and are not ours to publish.
- Pre-registered spec: frozen at
80e6c09, including the deviation log. - Analysis code: experiments/005-subintent-matched-panels/, including the post-hoc layer behind Result 3.
- The human panel comes from SparkToro’s study, used with thanks.
Changelog
- 6 August 2026: published.